Continuous Insights: Graphs And Metrics For Free
Simple method for gaining CI insights for private repos and commercial use – for free
Contents
- The end result
- How does it work
- Details and source code
- Pages repo and empty measurements file
- A custom reporter to update the measurements file
- Collect measurements
- Retrieve, update and store measurement data
- Add access keys
- Activate the report-coverage.sh script
- Visualize
- Warning: pages are public
- Next steps
- Comments
In my previous post about continuous integration I explained that I always quickly setup continuous integration for any project. In that post I explained that it gives safety, allows for easier collaboration, and gives more confidence that things keep working the way they should.
In this post I'll tell you about a nice trick that I have used a few times to get insights from your continuous integration. There are many third-party services that facilitate this of course, and they do so in a much nicer way than I'll be describing here. But the thing is: you're not allowed to use most of those for commercial purposes or private repositories. And sometimes you just don't have the money to spend on things like this. So read on if you want to know how you can easily gain insights with all the tools that you already have, for free.
The end result
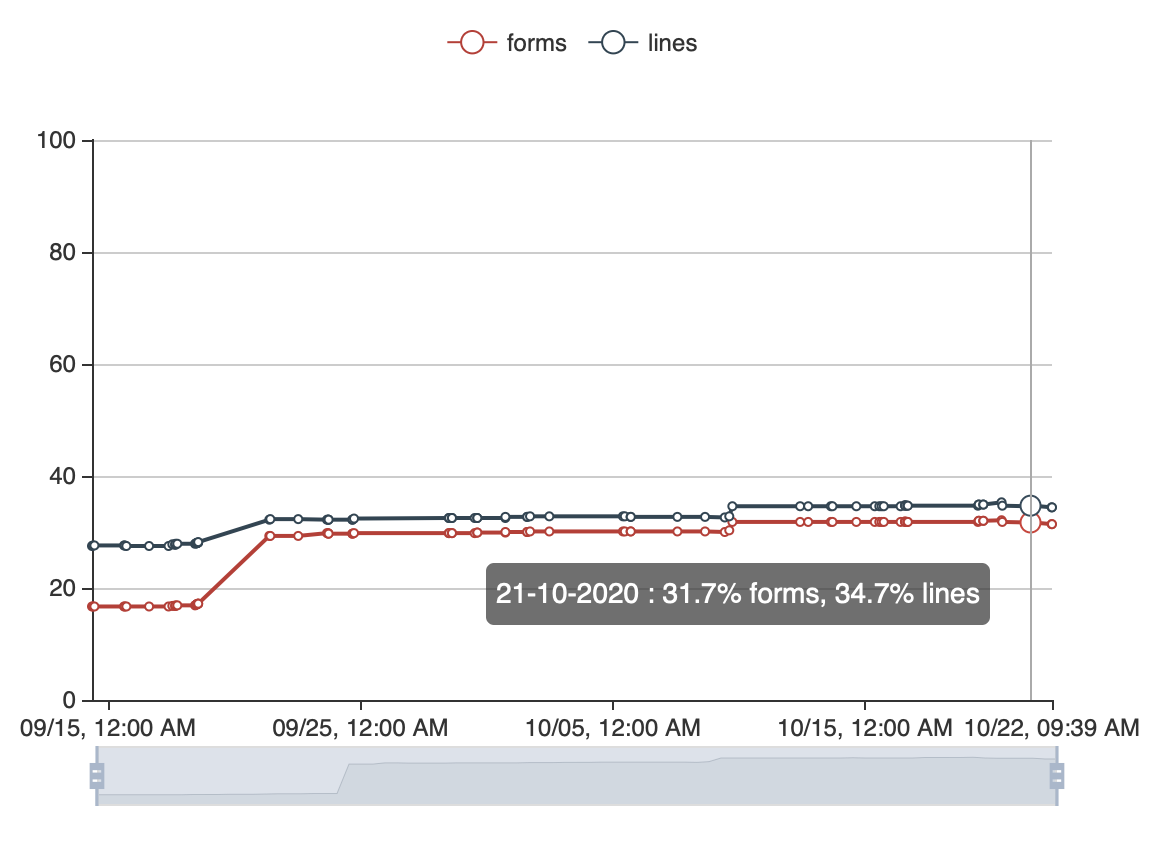
Let's start by showing an example of what we're going for. Below is a graph that shows two code coverage measurements over time. Each data point represents a build on the CI server. The graph is interactive and the CI server automatically causes the graph to be updated. After you have set everything up, there are no manual steps anymore.
How does it work
The solution leverages the ability to publish "pages" that most collaboration platforms have nowadays (e.g. GitHub, BitBucket, GitLab). This is basically a static web site that is hosted by the platform, using the content of a special git repository1 that you choose for that purpose. The CI system checks out this repository, updates the file containing the measurements, and commits and pushes it back to the repo. In a picture:
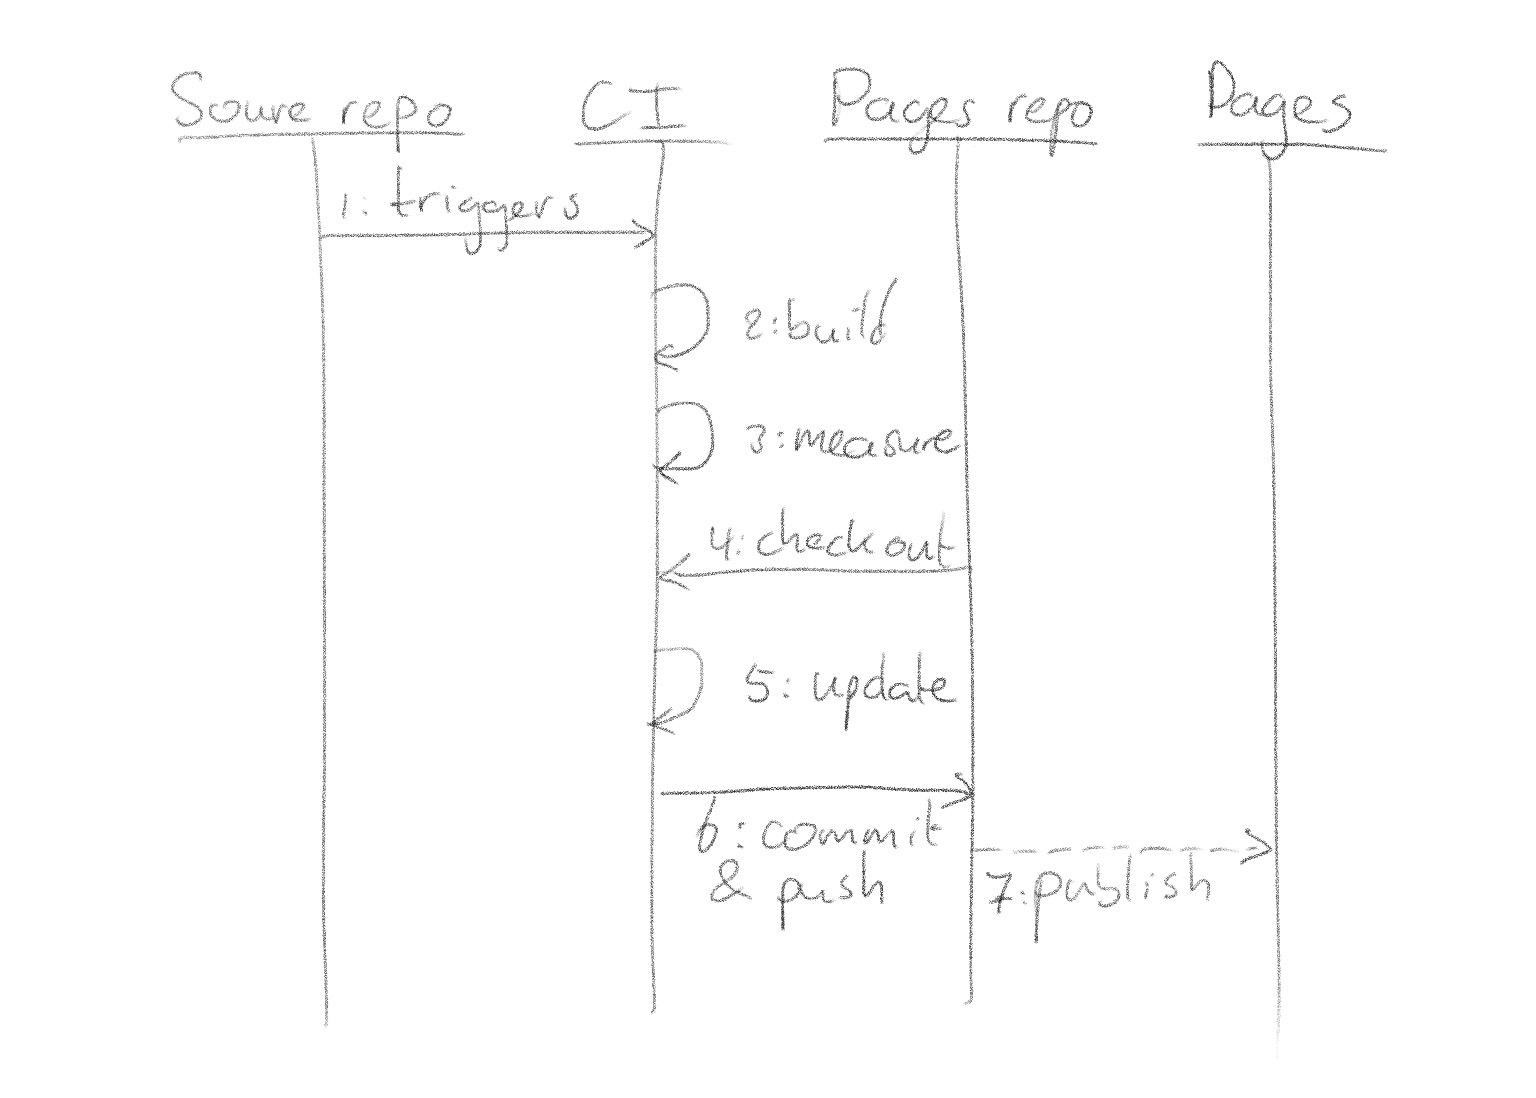
- You push to your source code repository, which triggers the CI server.
- The CI server builds your project (like before).
- The CI server takes the desired measurements, e.g. performance, coverage, etc.
- The CI server clones and checks out the repo where you published the graphs.
- The CI server updates the measurements file in that repository.
- The CI server commits the update and pushes it back to the pages repo.
- The pages repository gets deployed (this is done automatically by your collaboration platform).
Details and source code
Here come the details. In my description below, I'll assume that you're using CircleCI as your continuous integration tool, and BitBucket as your collaboration platform. Other choices are perfectly fine as well and the solution very similar; I'll leave the required changes needed for that as an exercise to the reader.
Pages repo and empty measurements file
First step is to create your pages repository. Go ahead and create it. Then clone it and add the empty file that we'll be storing the measurements in:
git clone git@bitbucket.org:my-org/my-pages-repo.bitbucket.io.git
cd my-pages-repo.bitbucket.io
mkdir my-awesome-project
touch my-awesome-project/stats.txt
git add my-awesome-project/stats.txt
git commit -m 'Creates empty measurements file for my-awesome-project'
git push
When all is well and correctly configured, BitBucket should now publish this
pages repository and you should be able to load the empty stats file in your
browser under https://my-pages-repo.bitbucket.io/my-awesome-project/stats.txt.
A custom reporter to update the measurements file
In my case, as I'm using Clojure and Leiningen. I'm using Cloverage to measure and report code coverage. I need to process the coverage data and write it out in my desired format, so I'll use a custom coverage reporter for that. Alternatively you might create a script that runs your coverage tool and parses its output.
(ns coverage-stats
  (:import
   [java.io File]
   [java.time Instant])
  (:require
   [clojure.string :as str]
   [cloverage.report :refer [file-stats]]))

;; This custom reporter can be used with Cloverage:
;;
;; ```
;; lein cloverage -c coverage-stats/report
;; ```

(defn summary [^File forms]
  {:post [(= 3 (count %))]}
  (let [stats (file-stats forms)
        data (mapv (juxt :forms :covered-forms :instrd-lines :covered-lines :partial-lines) stats)
        [total-forms total-covered-forms total covered partial] (apply mapv + data)]
    {:timestamp     (.toEpochMilli (Instant/now))
     :form-coverage (float (* 100 (/ total-covered-forms total-forms)))
     :line-coverage (float (* 100 (/ (+ covered partial) total)))}))

(defn report [{:keys [forms ^String output]}]
  (let [filename (str/join "/" [output "stats.txt"])
        existing-stats (slurp filename)
        {:keys [timestamp form-coverage line-coverage]} (summary forms)]
    (println "Writing stats:" filename)
    (spit filename (str existing-stats
                        (str/join "\t" [(str timestamp)
                                        (format "%.1f" form-coverage)
                                        (format "%.1f" line-coverage)])
                        "\n"))))
What this reporter does is basically:
- Read the contents of
stats.txt - Add a line in the format:
[timestamp]<TAB>[form-coverage]<TAB>[line-coverage] - Write the updated contents back to
stats.txt
Collect measurements
Now I can use this reporter to compute code coverage and update stats.txt. You
can test this in your dev setup:
lein with-profile dev,devsrc cloverage --no-html -c coverage-stats/report
Retrieve, update and store measurement data
Now I put this command in a script that does all the hard work. This is what it
looks like, you of course need to modify it for your specific circumstances. I
call this script report-coverage.sh and it lives in the root of my source code
repo.
#!/bin/bash

# Make sure script fails when command before pipe fails
set -o pipefail

# Make sure script fails on any error
set -e

currentBranch=$(git rev-parse --abbrev-ref HEAD)
if [ ${currentBranch} != "master" ]; then
    echo "Current branch is ${currentBranch}."
    echo "Coverage reporting is only done on master. Exiting."
    exit
fi

# Clone stats repo and get existing stats file
(
  mkdir -p target/coverage
  cd target/coverage
  git clone git@bitbucket.org:my-org/my-pages-repo.bitbucket.io.git
  cd my-pages-repo.bitbucket.io
  git config --local user.name 'Continuous Integration'
  git config --local user.email ci@my-org.com
  cp my-awesome-project/stats.txt ..
)

# Run coverage command; this updates `stats.txt`
lein cloverage --no-html -c coverage-stats/report

(
  # Copy updates stats file to repo clone
  cd target/coverage
  cp stats.txt my-pages-repo.bitbucket.io/my-awesome-project

  # commit new version
  cd my-pages-repo.bitbucket.io
  git add my-awesome-project/stats.txt
  git commit -m 'Updates my-awesome-project coverage stats'
  git push
)
Add access keys
For the above to work, you need to allow CircleCI access to push to your
BitBucket repo. In CircleCI I added a "user key" to my project's settings. Then
in BitBucket I added the public key as an SSH key to my organization. The
fingerprint of the key (as displayed by CircleCI) I added to my build's
config.yml (see CircleCI docs).
Activate the report-coverage.sh script
This should be enough to activate the collecting of measurements. Add a call to
the report-coverage.sh script in your config.yml and see whether it works.
And then, CI being CI, fix things, retry, fix, retry, etc until it works.
Visualize
Now for the final part: create a nice visualization. In your pages repository,
the one that you created above and where the stats.txt file lives, you add an
HTML file that will show a graph. Let's call it insights.html. I'm using the
following code for my visualization, but you can of course use any method you
like.
<html>

<head>
  <script src="https://code.jquery.com/jquery-3.5.1.min.js"
    integrity="sha256-9/aliU8dGd2tb6OSsuzixeV4y/faTqgFtohetphbbj0=" crossorigin="anonymous"></script>
  <script src="https://cdn.jsdelivr.net/npm/echarts@4.9.0/dist/echarts-en.common.min.js"></script>
  <script type="text/javascript">
    $(document).ready(function () {
      jQuery.get('https://my-pages-repo.bitbucket.io/my-awesome-project/stats.txt', function (data) {
        var myChart = echarts.init(document.getElementById('main'))
        var parsedData = data.split('\n')
          .filter(line => line.length > 0)
          .map(line => line.split('\t'))
          .map(line => [
            new Date(parseInt(line[0])),
            parseFloat(line[1]),
            parseFloat(line[2])
          ])
        var forms = parsedData.map(entry => [entry[0], entry[1]])
        var lines = parsedData.map(entry => [entry[0], entry[2]])
        var option = {
          xAxis: {
            type: 'time',
            splitLine: { show: false },
            axisLabel: {
              formatter: function (value, index) {
                var date = new Date(value)
                const options = { month: '2-digit', day: '2-digit', hour: '2-digit', minute: '2-digit' }
                const formatter = new Intl.DateTimeFormat(undefined, options).format;
                return formatter(date)
              }
            }
          },
          yAxis: { type: 'value', min: 0, max: 100 },
          legend: { data: ['forms', 'lines'] },
          series: [
            { name: 'forms', type: 'line', data: forms },
            { name: 'lines', type: 'line', data: lines }
          ],
          dataZoom: [
            { type: 'inside', xAxisIndex: [0] },
            { type: 'slider', xAxisIndex: [0] }
          ],
          tooltip: {
            trigger: 'axis',
            formatter: function (params) {
              var date = new Date(params[0].value[0]);
              var forms = params[0].value[1]
              var lines = params[1].value[1]
              return date.getDate() + '-' + (date.getMonth() + 1) + '-' + date.getFullYear() + ' : ' + forms + '% forms, ' + lines + '% lines';
            },
            axisPointer: {
              animation: false
            }
          }
        }
        myChart.setOption(option)
      })
    })
  </script>
</head>

<body>
  <h1>Graph</h1>
  <div id="main" style="width: 600px;height:400px;"></div>
</body>

</html>
Done! Go to
https://my-pages-repo.bitbucket.io/my-awesome-project/insights.html and admire
the result.
Warning: pages are public
One important warning: the metrics pages and graphs that you create this way are public on most platforms. You can of course "obscure" things by requiring people to know the exact URL to your graphs, and by being careful about what information you put in there. But requiring things like username/password is not possible using this method.
Next steps
You can easily extend the above to collect multiple different types of
measurements for many different projects, and add all of those to graphs in your
insights.html. It's just more of the same.
Also, as I'm writing this blog post, I'm thinking that it should probably also be possible to setup Grafana in such a way that you can view the graphs in your dashboard. This of course requires you to run Grafana somewhere (so no longer without third-party tools), but that might be a nice next step.
Comments
Since this is a privacy-friendly static web site, I'm not including the ability to post comments directly here. I do love feedback though, so I created a ticket on GitHub that you can use to leave your comments. Tell me if it's bad, tell me if it's good, but please don't forget to tell me why. So please head over there and leave your comments!
Some platforms also support using a separate branch of your normal source code repository instead of a separate repository.
↩